
The Role of Hormone Receptors and Clinical Factors in Breast Cancer Survival Prediction
Introduction
Breast cancer is a disease where abnormal cells in the breast grow out of control, mainly forming female tumours, with 99% of cases occurring in women.[1] Breast cancer risk increases with some factors such as age, lifestyle (like alcohol use and obesity), gene factors, and clinical factors [2][3].
Fan et al. developed statistically significant models for predicting relapse-free survival (RFS) over 7 years across the entire patient population, specifically for ER-positive and Luminal tumour subgroups. Additionally, models integrating clinical and genomic data provided better prognostic accuracy than those relying solely on clinical or genomic factors [4].
Also, it’s becoming common for breast cancer prognosis to rely on factors like patient age, tumour size, grade, and biomarkers (e.g., HER2, ER, PR). Gene-expression profiling adds precision by classifying tumours into subtypes, improving predictions and guiding personalised treatment, especially for low-risk patients [5].
A dataset containing 295 individuals who were diagnosed and treated for breast cancer at the Netherlands Cancer Institute was used to predict patient breast cancer prognosis, focusing on three questions:
a. How well can standard clinicopathological variables help to classify an individual’s chance of being distant metastasis-free after 5 years?
b. Do the data show a clear link between breast cancer survival and hormone receptor status (ER/PR/HER2)?
c.Does combining the traditional variables with the gene expression data improve the ability to predict patient prognosis?
Notation and subset
Throughout this blog, variable names in the dataset will be written in italics and abbreviated where appropriate, for example, Cl03_Size_mm to as tumour size, Cl01_Age to Age, Cl02_pN_pos to Lymph Node, I01_ER_2007 as Estrogen, I02_PR_ 2007 as progesterone, I02B ER/PR clinical as ER_PR.
The ID column will be dropped as it’s unnecessary for our analysis. To answer questions a and b, we will focus only on patients’ clinical and pathological data (first 21 variables) except the first ID column. To answer question c, we will additionally use patient gene expression data. After analysing the data, we found that the same five patients didn’t have central collagen, matrix formation, and necrosis values, so we removed them. If The patient doesn’t have Estrogen, progesterone, or ER_PR value, remove them from the analysis. Finally, before proceeding to the model, we removed null values from all variables.
Overview of Data
Dataset and code link – https://github.com/sabbirdewan/breast-cancer-survival-prediction
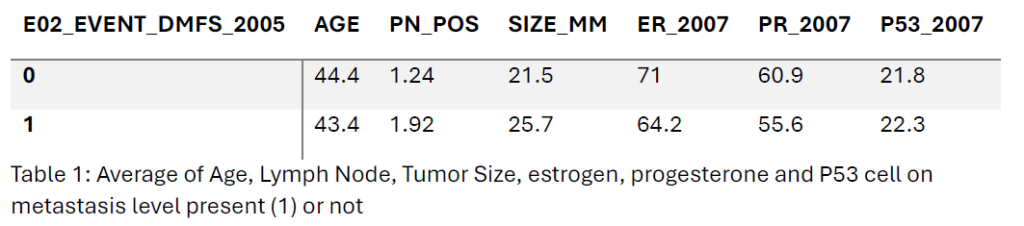
Patients with distant metastasis (E02 Event DMFS 2005 = 1) will call metastasis-positive patients, and patients with distant metastasis (E02 Event DMFS 2005 = 0) will call metastasis-free patients throughout the analysis.
Metastasis-positive patients had an average age of 43.4 years, slightly lower than 44.4 years in those metastasis-free patients. They also had more positive lymph nodes (1.92 vs. 1.24) and larger tumours (25.7 mm vs. 21.5 mm). Estrogen (ER) and progesterone receptor (PR) positivity were lower in metastasis-positive patients (64.2% and 55.6%) compared to metastasis-free patients (71.0% and 60.9%). P53 expression showed no significant difference between the two groups.
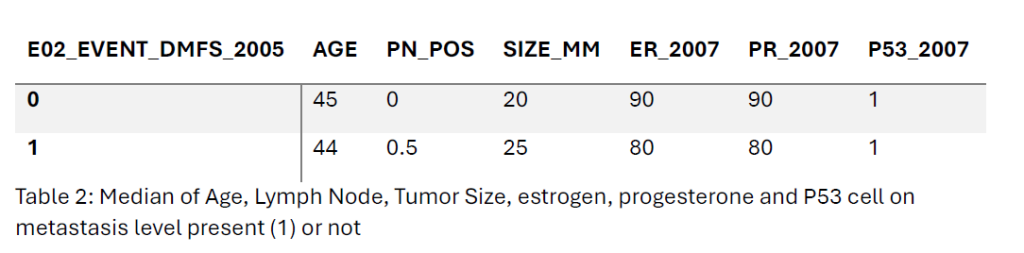
The median age of patients with distant metastasis (E02 Event DMFS 2005 = 1) was 44 years, slightly lower than 45 years for those without metastasis. In the metastasis-free patient’s group, the patient had a median of 0 positive lymph nodes, while the median increased to 0.5 in the metastasis-positive group. Tumor size was larger in metastasis-positive patients (25 mm vs. 20 mm). Estrogen (ER) and progesterone receptor (PR) positivity medians were lower in the metastasis-positive group (80% for both) compared to the metastasis-free group (90% for both). P53 expression remained consistent at 1 for both groups.
From the below pair plot, the Age and Size of the Tumor are almost normally distributed, but no positive lymph node data are right skewed, and most of the observations are below 5mm. Also, we can see the average size is (1.24 for 0 and 1.94 for 1). Estrogen and progesterone follow the same distribution of data and follow bimodality, as most of the observations are either close to the right tail or the left tail. And P53 observations are right-skewed data also and mostly less than 25.
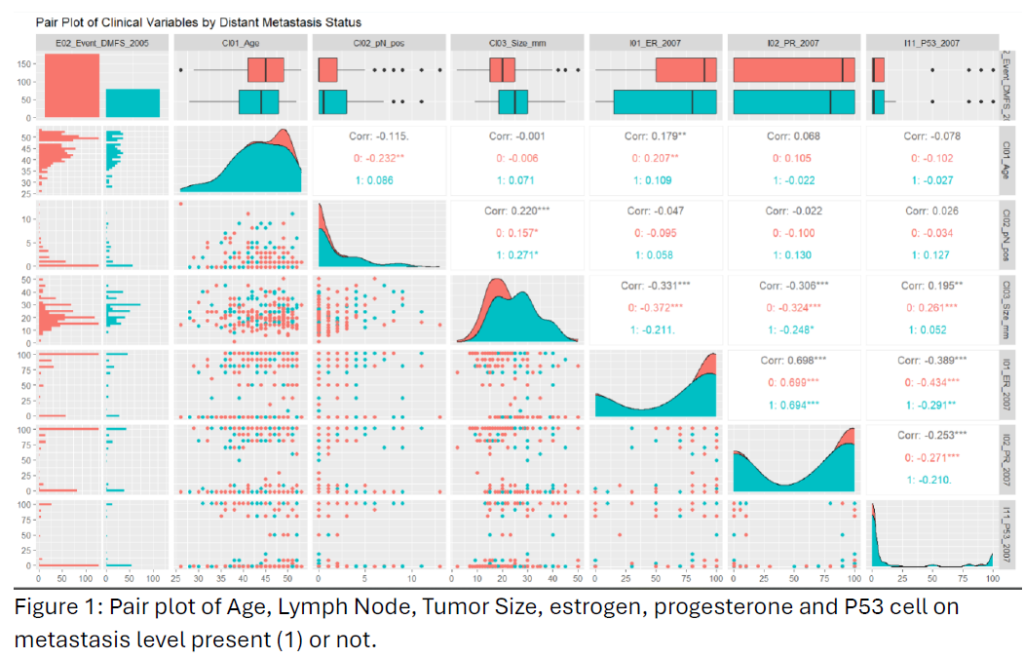
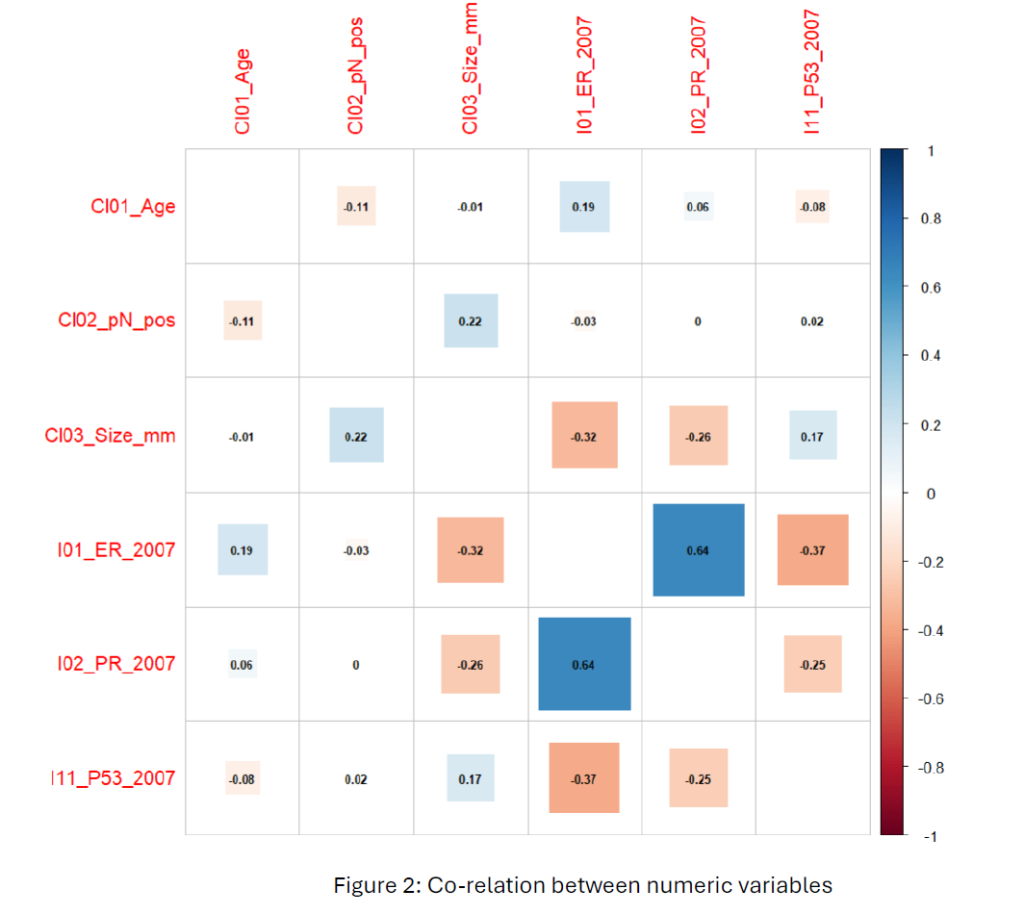
From Figure 2, The correlation plot reveals a moderately strong positive relationship (0.64) between estrogen (ER) and progesterone (PR), indicating an influence in hormone receptor-positive breast cancer cases. Other variables have weak correlations between clinical variables (age, tumour size, lymph node status) and biomarkers, indicating these variables are independent.
Method for Answering question 1
The below models classify breast cancer patients as distant metastasis-free (DMFS) or not five years after diagnosis using Linear Discriminant Analysis (LDA.).
DMFS ~ log (Age) + log (Lymph Node) + log (Tumour Size – (1)
DMFS ~ log (Age) + log (Lymph Node) + log (Tumour Size) + Estrogen + Progesterone – (2)
This model performs LDA with Age, Lymph Node, Tumor Size, Estrogen and Progesterone. Other variables are not suitable and not important in classifying metastatic patients. The log transformation of Age, Lymph Node, and Tumor Size allowed theses variables a distribution closer to a normal distribution. We tried different combinations of variables on this model while using only Age, Lymph Node, and Age; the hit rate was 68%, but when Estrogen and Progesterone the hit rate increased to 69%. Then, leave-one-out cross-validation was applied to model 1 and model 2.
LD1=(−2.5011).log(Age)+(0.2815)⋅log(Lymph Node+1)+(2.4552)⋅log(Tumour Size+1)+(−0.0008)⋅Estrogen+(0.0030)⋅Progesterone – (3)
The observed prior probabilities (0.693 for no metastasis and 0.307 for metastasis) indicate an imbalance, with most cases classified as no metastasis. This imbalance led to a tendency for the model to favour the no metastasis classification. A double cost was applied to misclassifying metastasis. While this adjustment decreased the overall hit rate to 63%, it improved the model’s ability to correctly classify metastasis cases, increasing the hit rate for class 1 by 42.3% (from 9 to 33 out of 78).
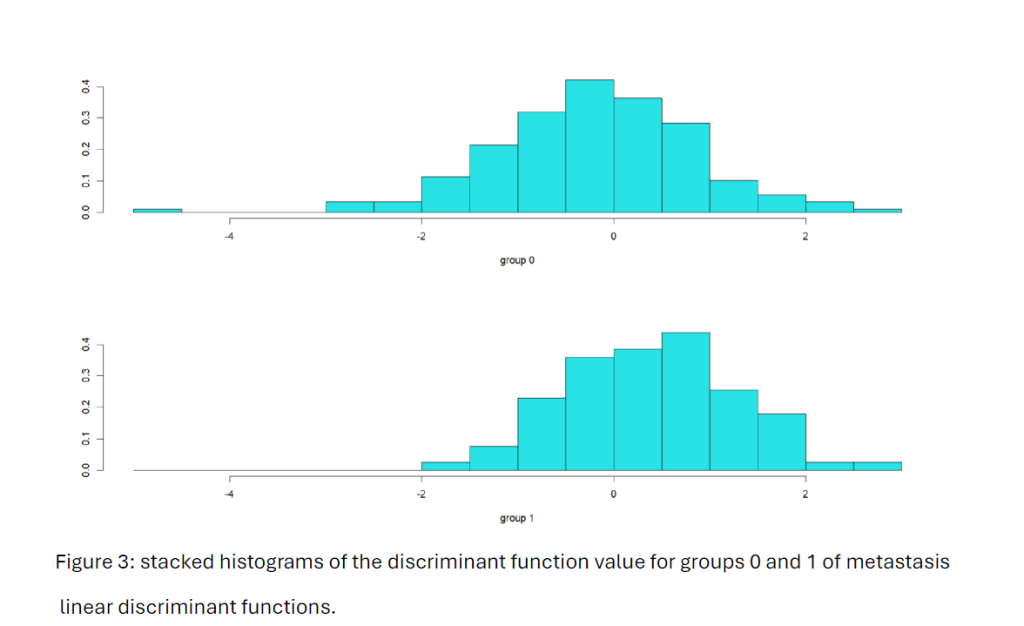
We note that the Figure 3 histograms for each group of metastasis levels do not create well separation between the two groups.
Then, PCA was conducted on numerical clinical variables. The data was scaled to ensure that all variables contributed equally to the analysis. The KNN model was set with a maximum consideration of 8 nearest neighbours. KNN classifications were performed using cross-validation. The first 2 principal components captured 50% of the dataset’s variability. The final KNN model was trained using the first two principal components with the optimal number (k = 3) of neighbours. The optimal number of K was chosen based on the lowest misclassification rate. The hit rate reached the maximum of 72% to classify metastasis patients.
Method for Question B
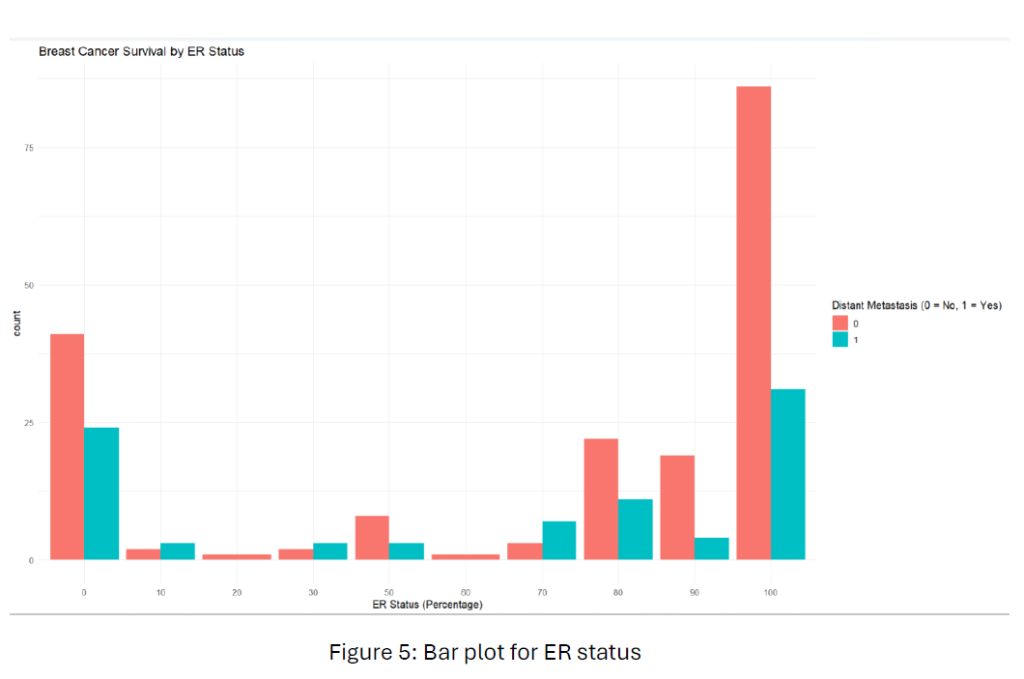
To find the relationship between hormone receptor status (ER, PR, HER2) and breast cancer survival, we used a subset of the data that included only the hormone receptor variables and survival outcome. From Figure 5, Patients with higher ER expression (e.g., 80-100) tend to have a lower rate of distant metastasis than those with lower ER expression. This suggests that ER-positive breast cancers might be associated with a better prognosis.
From Figure 6, like in the ER, patients with higher PR expressions seem to have a lower rate of distant metastasis. This further indicates the potential association between hormone receptor positivity and improved survival.
To measure these assumptions, we conducted hierarchical clustering. Using Ward’s D2 method, we selected two clusters (k = 2) to differentiate between metastasis-free and metastasis cases. Clustering analysis achieved a hit rate of 56%, indicating that hormone receptor status (ER, PR, and HER2) is moderately associated with classifying patient metastasis status.

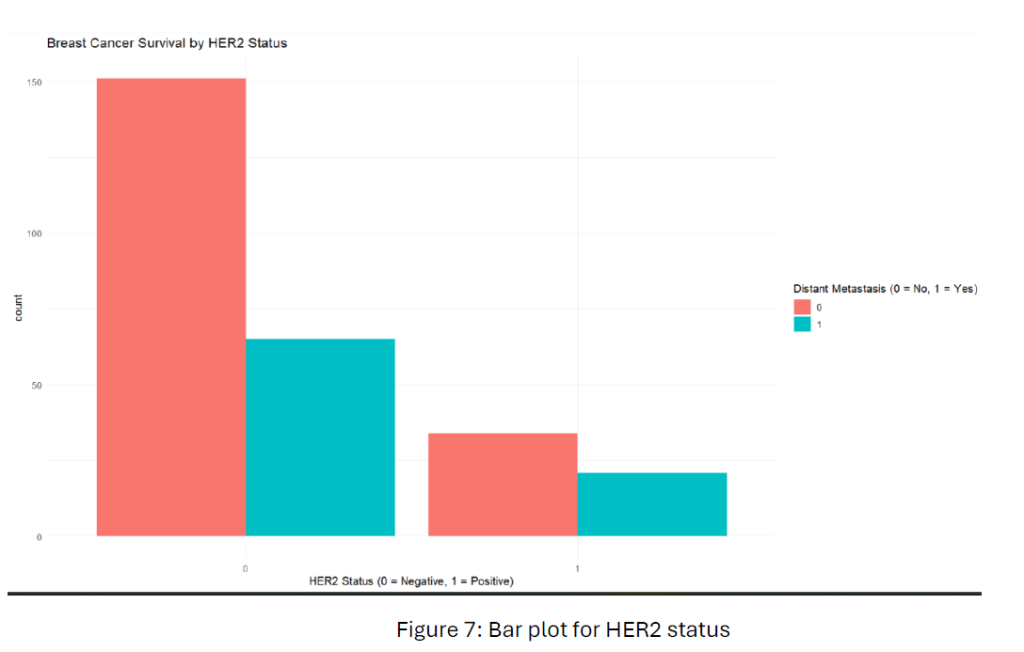
From Figure 7, HER2-negative patients show a higher metastasis-free rate than HER2-positive patients. This suggests that HER2-negative status might be associated with a better breast cancer prognosis compared to HER2-positive status.
We applied K-means clustering to investigate further and determine the optimal number of clusters using the “within-group sum of squares” (WSS) method. Using an elbow plot,” identified the optimal number of clusters by looking for the elbow point 2 from Figure 8.
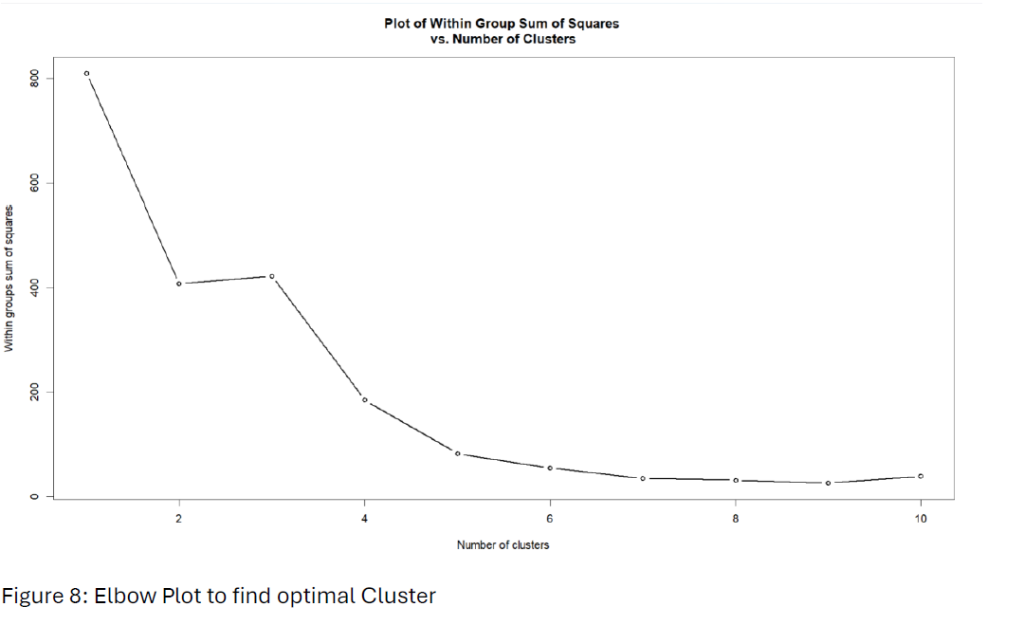
Hit rate of 2-means clustering increased to 63.5% compared to the clustering analysis.
Method for Question C
To evaluate whether adding gene expression data improves the prediction of patient breast prognosis, we combined traditional clinicopathological variables with gene expression data. As the gene expression data’s high dimensionality (I,e – 111 Variables), Principal Component Analysis (PCA) was applied to reduce the number of predictors while retaining most data variance. The first 34 PCs were considered as they totally explained 80% of the variance in the gene expression data. Then, we conducted Linear Discriminant Analysis (LDA) using PCA’s first 34 principal components. The linear discriminant function for LDA is given by –
LDi=β0+j=1Σ34βj⋅PCij
Results and discussions
3.1 Part a
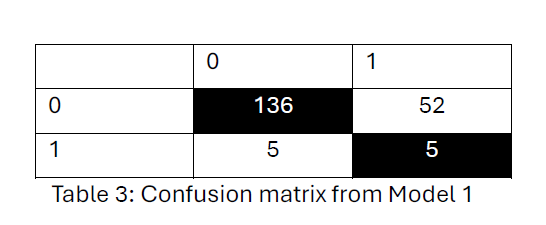
From model 1, the confusion matrix from Table 3 says the model correctly classified 136 patients as metastasis-free (0) and 5 patients as metastasis-positive (1). 52 metastasis-free patients were incorrectly classified as metastasis-positive, and 5 metastasis-positive patients misclassified as metastasis-free. Overall, hit rate is 69%.
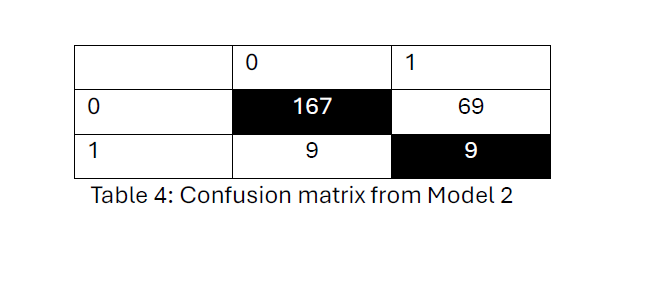
Model (2) confusion matrix from Table 4, indicates the model has a high ability to classify no distant metastasis (class 0) (167 out of 176) correctly but struggles significantly with identifying cases of distant metastasis (class 1) (9 out of 78). The overall hit rate is 69.3%.
Model 1 and Model 2 hit rates are the same in identifying metastasis-free cases but show limited accuracy in correctly identifying metastasis-positive cases.
Applied leave-one-out cross-validation on model 1, the hit rate decreased to 66%.
Applied leave-one-out cross-validation on model 2, but the hit rate decreased to 67% compared to a model with 5 variables without cross-validation. The priors reflected the proportion of patients experiencing distant metastasis (E02_Event_DMFS_2005). We notice that the prior corresponding to no metastasis (0) is much higher than the prior for metastasis (1) (0.693 versus 0.307). Given the difficulty in finding a clear separation between these two outcomes in the model’s group, the linear discriminant functions cannot readily produce a significant separation between these groups. Consequently, the prior probabilities corresponding to these groups significantly impact determining the classifications. The significantly higher prior probability for the metastasis-free group leads to the predominance of classifications favouring this outcome.
After Applying cost double to misclassify distant metastasis (class 1) and considering leave-one-out cross-validation, the hit rate decreased to 63%. However, the hit rate of classifying distant metastasis positive (class 1) increased by 42.3% (33 out of 78). As mentioned in section 2.1, LDA is not a suitable option due to the imbalance in prior probabilities.
After Applying PCA, the overall hit rate of 72.7% indicates a moderate level of accuracy for this PCA-KNN model in classifying patients based on metastasis status.
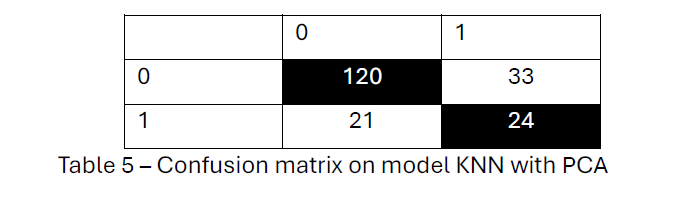
Although the model correctly classified 120 patients from Table 5 as metastasis-free and 24 patients as metastasis-positive, it misclassified 33 metastasis-free patients and 21 metastasis-positive patients. 2 PCA and KNN with k= 3 achieved more accuracy in predicting metastasis-free survival, with a hit rate of 72.7%.
Results for part b
We used hierarchical clustering to evaluate whether hormone receptor status (ER, PR, and HER2) is linked to breast cancer survival and assessed the resulting clusters against actual metastasis outcomes. The hit rate is approximately 56.1%.

From Table 6, Group 1 consists of metastasis-free patients (117 out of 168) and many metastasis-positive patients (51). However, it is clear that a possible association between certain hormone receptor profiles has to be metastasis-free for the patient.
Group 2 Contains a mix of metastasis-free (68) and metastasis (35) cases, showing less clear separation based on survival outcomes.
Applied K-means achieved a hit rate of 63.5%, greater than the hierarchical clustering model’s 56.1% hit rate. From Table 7, Group 1 Primarily consists of metastasis-free patients, with 151 correctly classified as metastasis-free, though 65 metastasis cases were also included.
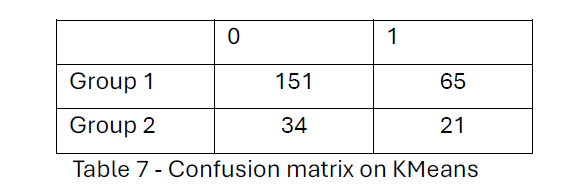
On the other hand, Group 2 has a smaller number of patients, including 34 metastasis-free and 21 metastasis-positive cases, showing a slight tendency to capture metastasis-positive cases. In both analyses, one cluster (Group 1) predominantly contained metastasis-free patients. However, K-means clustering achieved better separation, with fewer metastasis-positive patients misclassified in the metastasis-free group (65 in K-means vs. 51 in hierarchical clustering).
Answer for part c-
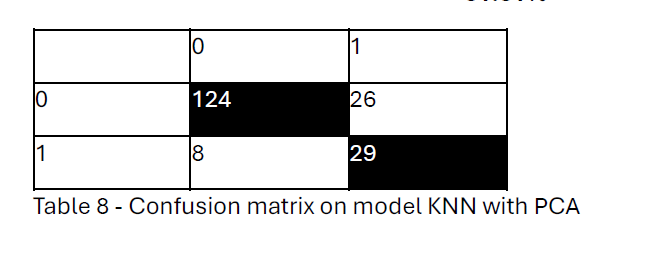
The linear discriminant model classified Group 0 almost perfectly 8 observations were misclassified, and 124 observations were correctly classified. However, for Group 1 the model classified 29 observations were correctly classified and 26 observations were misclassified. Due to imbalanced classification, Group 0 is approximately 71% of observations, and Group 1 is approximately 29 %. Even though the hit rate is 81.81%, the model’s performance is poor for predicting Group 1, in which distant metastasis occurs.
Hit rate =(124+29)/(124+26 + 8 +29)
= 81.81%
References
[1] https://www.who.int/news-room/fact-sheets/detail/breast-cancer
[2] https://www.mayoclinic.org/diseases-conditions/breast-cancer/symptoms-causes/syc-20352470
[3] https://www.breastcancer.org/risk/risk-factors
[4] Fan, C., Prat, A., Parker, J.S. et al. Building prognostic models for breast cancer patients using clinical variables and hundreds of gene expression signatures. BMC Med Genomics 4, 3 (2011). – https://link.springer.com/article/10.1186/1755-8794-4-3#citeas
[5] Grazia Arpino, Daniele Generali. Et al. Gene expression profiling in breast cancer: A clinical perspective – https://doi.org/10.1016/j.breast.2013.01.016.